Mrs. Shamita has 20 bookmarks. She gives 4 bookmarks to each of her children so that no bookmark is left. How many children does Mrs. Shamita have? A3B4C5D6
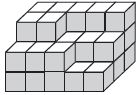
Count the number of cubes in the given figure. A30 B33 C35 D40
Select a figure from the options in which the given figure is exactly embedded as one of its parts. A B C D
If the sum of two consecutive odd numbers is 188. Find the numbers. A87, 101 B92, 96 C91, 93 D93, 95
Tank A contains 5 times as much water as Tank B. How much water must be transferred from Tank A to Tank B so that each tank contains 45 litres of water? A30 litres B60 litres C75 litres D45 litres
28% of the fruits in a bag are apples. 40% of the remaining are oranges and the rest are pears. What fraction of the fruits are pears? A 54⁄125 B 27⁄75 C 38⁄125 D 19⁄75
A water tank can hold litres of water. How much water will be contained in 3 such tanks? A B C D
Trishi sold 326 magazines on Monday. She sold 89 less magazines on Tuesday than Monday. How many magazines did she sell altogether on both days? A741 B415 C474 D563
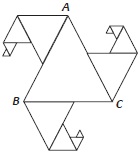
In the given figure, all triangles are equilateral and AB = 16 units. Other triangles have been formed by taking the mid points of the sides. What is the perimeter of the figure? A92 units B93 units C91 units DNone of these
A tailor sews the same number of shirts every day. If he sews 35 shirts in a week, how many shirts does he sew each day? A3B4C5D6


 litres of water. How much
water will be contained in 3 such tanks?
litres of water. How much
water will be contained in 3 such tanks?