A person works 35 hours 35 minutes in a week. Find the duration of his daily work. A305 minutes B5 hours 5 minutes C315 minutes DBoth (A) and (B)
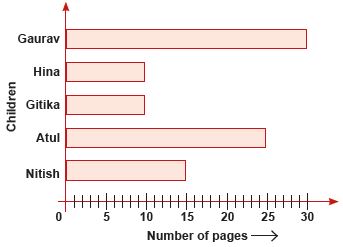
The given bar graph shows the number of pages read by 5 children in a week. Study the graph carefully and answer the following question. How many more pages did the other four children read in total than Hina? A30 B60 C70 D80
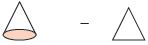
Which shape is used to form the base of a cone? ACircle BSquare CRectangle
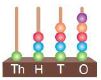
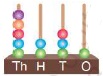
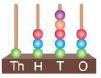
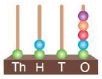
Which of the given abacuses shows the number less than 1345? A B C D
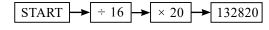
What could be the number in the START box? A116256 B106256 C384120 D102656
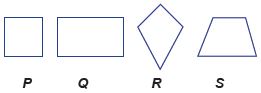
Which of the following figures has exactly one pair of parallel lines? AP BQ CR DS
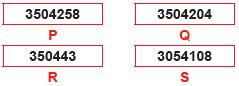
The correct ascending order of the following numbers, is __________. AR, S, Q, P BR, P, Q, S CP, Q, S, R DS, R, Q, P
Select the correct match of the shaded face and its shape. A B C D
Select a figure from the options which is exactly embedded in the given figure as one of its parts. A B C D
In Mayan number system, 1875 is written as A B C D