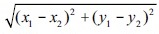
Study the statements carefully and select the correct option. Statement-1 : The distance between two points (x1, y1) and (x2, y2) is . Statement-2 : The point(s) on the x-axis which has its distances from the points (7, 6) and (-3, 4) in the ratio 1 : 2 is or (-9, 0) A Both the statements are true. B Statement-1 is true but statement-2 is false. C Statement-1 is false but statement-2 is true. D Both the statements are false.
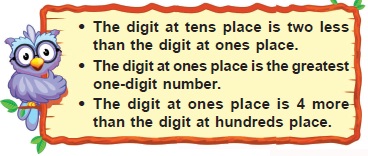
Identify the 3-digit number. A458 B568 C579 D719
What is the least number which when divided by 15, 18 and 21 leaves remainders 2, 5 and 8 respectively? A610 B617 C720 DNone of these
A square and a rectangle have the same area of 144 cm2. If length of the rectangle is 4 cm more than the side of the square, then find the breadth of the rectangle. A12 cm B9 cm C16 cm D15 cm
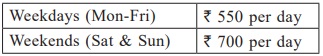
Workers in a factory are paid according to the following rates: If a worker worked from Friday to Tuesday, then how much total money will he get? A₹ 1980 B₹ 2150 C₹ 2050 D₹ 3050
Out of 208 people in a party, 48 were children. The remaining people, males and females, are in the ratio of 2 : 3. Find the number of males and females in the party respectively. A84, 125 B125, 84 C96, 64 D64, 96
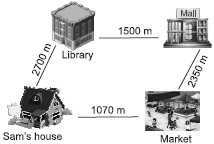
Study the given figure carefully. Route 1 - Sam's house - Library - Mall Route 2 - Market - Mall - Library Which is the longer route and by how much? ARoute 1, 250 m BRoute 2, 4200 m CRoute 1, 350 m DRoute 2, 350 m
Study the statements carefully and select the CORRECT option. P. When a number is divided by itself, then the quotient is 0. Q. When a number is divided by 1, then the quotient is number itself. ABoth P and Q are true. BBoth P and Q are false. CP is true but Q is false. DP is false but Q is true.
Mohit and Rohit each have certain number of oranges. Mohit says to Rohit, "if you give me 10 of your oranges, I will have twice the number of oranges left with you". Rohit replies, "if you give me 10 of your oranges, I will have the same number of oranges as left with you." Find the number of oranges with Mohit and Rohit respectively. A50, 70 B70, 50 C60, 60 D80, 40
How many tens must be subtracted from 7280 to get 480? A680 B480 C48 D68
 .
. or (-9, 0)