What fraction of the letters in the given word are consonants? PRONUNCIATION A5/13 B6/13 C7/13 D4/11
The number that can be divided by both 3 and 12 may not be divided by ______. A2 B6 C12 D8
Read the following statements carefully and state T for true and F for false. P : The product of a proper and an improper fraction is always less than the improper fraction but greater than the proper fraction. Q : The product of an improper fraction and a whole is always less than the whole number. R : The quotient obtained on dividing a whole number by a proper fraction, is always greater than the dividend. AP – T, Q – T, R – T BP – F, Q – F, R – T CP – T, Q – F, R – F DP – F, Q – T, R – F
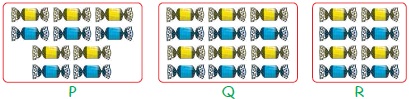
Group ________ has the least number of candies. AQ BP CR DCan't be determined
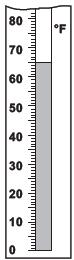
Which is closest to the temperature shown on this thermometer ? A69°F B60°F C58°F D65°F
Which of the following statements is incorrect ? ATwo triangles having same area are congruent. BIf two sides and one angle of a triangle are equal to the corresponding two sides and the angle of another triangle, then the two triangles are congruent. CIf the hypotenuse of one right angled triangle is equal to the hypotenuse of another right angled triangle, then the triangles are congruent. DAll of these
Which of the following options are arranged in ascending order? A B C D
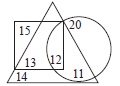
In the given Venn diagram, triangle represents teachers, circle represents child specialist doctors and square represents women specialist doctors. Which of the following numbers represent teachers who are child specialist doctors but not women specialist doctors? A12 B20 C11 D13
The value of ₹ 9428 ÷ 4 is A₹ 2357 B₹ 2057 C₹ 3257 D₹ 1357
Read the given statements carefully and select the correct option. Statement-I : The smallest 4-digit number which is by exactly divisible by 18, 24 and 32, is 1152. Statement-II : The common prime factors of 16 and 50 are 2 and 3. ABoth Statement – I and Statement – II are true. BBoth Statement – I and Statement – II are false. CStatement – I is true but Statement – II is false. DStatement – I is false but Statement – II is true.