The line graph shows the number of storybooks Armaan read in the last 4 months of a year.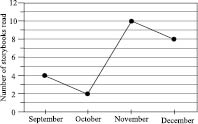
The ratio of storybooks he read in September to November is
A1 : 4
B4 : 1
C2 : 5
D5 : 2
The line graph shows the number of storybooks Armaan read in the last 4 months of a year.
The ratio of storybooks he read in September to November is
A1 : 4
B4 : 1
C2 : 5
D5 : 2