Subject :NSO Class : Class 4
Which of the following graphs shows the relationship between the number of deaths of organisms in a canal and the amount of refuse in it?
A 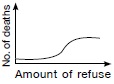
B 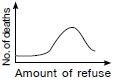
C 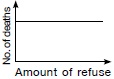
D 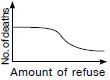
a
Ans 1:
Class : Class 4
Ans 2:
Class : Class 7
Could somebody explain the meaning of the question.
Ans 3:
Class : Class 4
A is write suvanjot check solution
Ans 4:
Class : Class 9
Please tell the answer of this question
Ans 5:
Class : Class 5
Roshni is right
Ans 6:
Class : Class 7
A IS RIGHT ANSWER
Ans 7:
Class : Class 4
B SHOULD BE THE RIGHT ANSWER BECAUSE WE ARE PLOTTING NO. OF DEATHS AND NOT NO. OF ORGANISMS...SO AS THE AMOUNT OF REFUSE INCREASES THE NO. OF DEATHS WILL INCREASE TILL ALL THE ORGANISMS DIE AND THUS THE DEATHS DECEASE