The overuse of fertilisers in a farm results in the runoff pollution of nearby river. Which of the following graphs correctly represents the resulting changes in the levels of oxygen and bacteria in that river?

A 
B 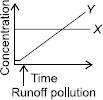
C 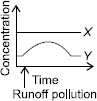
D 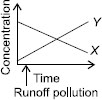
Could someone pls explain?
Ans 3:
Class : Class 8
The ans is not DEutrophication decreases oxygen and the graph shows increasing oxygen