The given graph shows the temperature changes when a sample of ice is heated. What is happening at point 1?
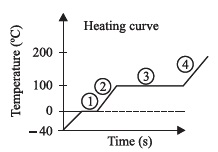
A The liquid is evaporating.
B The liquid is freezing.
C The solid is freezing.
D The solid is melting.
The given graph shows the temperature changes when a sample of ice is heated. What is happening at point 1?
A The liquid is evaporating.
B The liquid is freezing.
C The solid is freezing.
D The solid is melting.