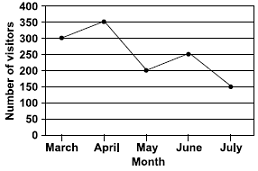
The line graph shows the number of people who visited a museum from March to July. How many more visitors were there in April than in June?
A200
B350
C150
D100
Ans 1:
Class : Class 5
the ans is 100 because in April 350 visitors visited the museum and in June 250 visitors visited the museum.So,100 visitors were more in April than in june