Subject :NSO Class : Class 6
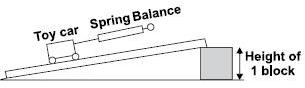
A group of students carried out an experiment to find out how the force applied to pull the toy car up the ramp varied with the height of the ramp as shown in the given diagram. They varied the height by changing the number of the blocks.
Which one of the following graphs best illustrates their results?
(A) 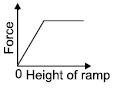
(B) 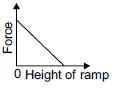
(C) 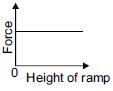
(D) 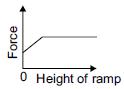
Ans 1:
Class : Class 6
A
Ans 2:
Class : Class 6
the answer is (a) because the more the height of the ramp the more you need to give force