Ramesh heated some ice in a beaker. He recorded the temperature at regular time intervals. From his results, he drew the following graph: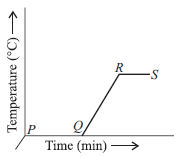
Which part of the graph shows melting of ice?
APQ
BQR
CRS
DRQ
can you explain how the answer A
Ans 3:
Class : Class 7
PQ shows the time taken by the ice to melt into water. Here, the temperature is steady â at 0°C. QR shows the time taken by the melted water to heat up and reach boiling point. Here, the temperature rises to boiling point â from 0°C to 100°C. RS shows the time taken by the water to evaporate. Here again, the temperature is steady â at 100°C. Part PQ shows melting of ice.Hence, the right answer is Option A.