Which of the following graphs represents the change in intensity of moonlight during a month? (Graphs are not upto scale)
A 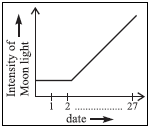
B 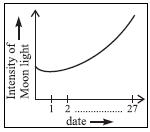
C 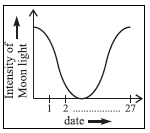
D 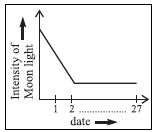
Which of the following graphs represents the change in intensity of moonlight during a month? (Graphs are not upto scale)
A
B
C
D