Refer to the given food chain operating in a small pond.
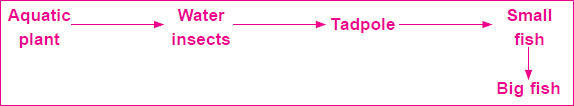
An organism ‘X’ was introduced in the community which exclusively feeds on tadpole population. Which of the following graphs correctly shows the changes in populations of water insect and small fish over time after introduction of organism X?
A 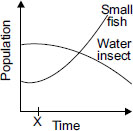
B 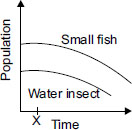
C 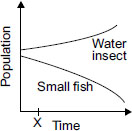
D 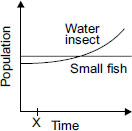
Can somebody pls explain the solution
Ans 2:
Class : Class 4
In the given food chain, tadpole feeds on water insect and in turn is eaten by small fish. If population of tadpole will decline with time then small fish population will also decrease as former is the food of later. On the other hand, water insect population will be positively affected because in the absence of predator prey population reproduces and flourishes.
Ans 9:
Class : Class 9
Aarush , there will be not enough plants to feed so many water insects . So, at a particular time all plants will finish . So , there will be nothing left for the water insects so they will also die !
Ans 10:
Ans 12:
Class : Class 8
The correct answer is C because if organism X wipes out all tadpoles in the community, then water insects' population grows with nothing to eat them. The small fish die because they have nothing to eat, and soon the big fish die too.