The graph below shows the temperature of a beaker of water as it is subjected to various treatments.
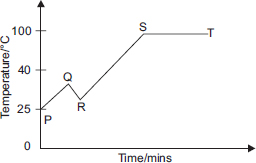
What could have taken place at point Q?
A The beaker of water was kept on burner with full flame.
B Ice cubes were added to the beaker of water.
C A small amount of salt was added to the beaker of water.
D Some water was poured out of the beaker.
Ans 11:
Class : Class 5
I can, At first, the temperature was 25 degree Celsius, but then the temperature increased P to Q means that it increased from 25 degree Celsius. so the only reason why the temperature increased was that some salt was added
Ans 14:
Class : Class 5
Ans:A because in the solution it is mentioned about decrease in temperature but at point Q in it is decreasing.
Ans 15:
Class : Class 7
THE CORRECT ANSWER IS B AS WHEN ICE CUBES WERE ADDED TO THE POINT 'Q' THE TEMPRATUREAT POINMT' R 'DECREASED