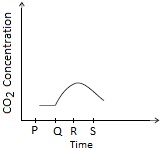
The amount of carbon dioxide in the air in an area was seen to change over a period of time as shown in the graph here.
Select the most suitable option regarding this.
AA factory has been established in that area at time S.
BDeforestation has been done in that area at time Q.
CA new forest has been established there at point P.
DLarge number of vehicles run by fossil fuels have been introduced in that area at point R.
Ans 1:
Class : Class 5
The given graph shows that amount of CO2 increases from time Q to R The increases in CO2 amount during interval Q R is indicative of activities like deforastation burning of fossil fuels increases in vehicular transport etc.
Ans 2: (Master Answer)
Class : Class 1
The given graph shows that amount of CO2 increases from time Q to R. The increase in CO2 amount during interval Q â R is indicative of activities like deforestation, burning of fossil fuel, increase in vehicular transport etc.