The graph shows the movement of a car over a period of 50 s.
The distance travelled by the car while its speed is increasing is _____.
(a) 100 m
(b) 200 m
(c) 300 m
(d) 400 m
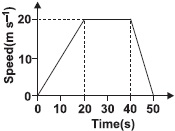
The graph shows the movement of a car over a period of 50 s.
The distance travelled by the car while its speed is increasing is _____.
(a) 100 m
(b) 200 m
(c) 300 m
(d) 400 m