Study the bar graph carefully and answer the given question.The bar graph below shows the different types of books that a group of pupils read during the school holidays.
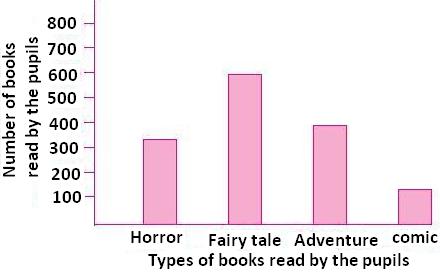
The pupils read _____ fewer comic books than fairy tale books.
(B) 250
(C) 300
(D) 450