The given graph shows the changes in the population of an insect found on a Jackfruit tree after four different sprayings of the same insecticide.
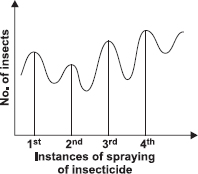
What conclusion can you draw from the graph?
A The insecticide had no effect on the insects at all.
B The insect population had become resistant to the insecticide.
C The insect population increased as the wrong type of insecticide was used.
D The insecticide helped to reduce the number of insects permanently.
Ans 2:
Class : Class 10
It is C because after the guy used the 3rd and 4th pesticide the insects started increasing
Ans 6:
Class : Class 7
I think the right answer should be C as when the 3rd spray was conducted the pest started to increase hence right answer answer is CThank you for appreciating me
Ans 7:
Class : Class 5
IF B IS ANSWER THAN GRAPH SHOULD BE ALMOST UNIFORM.. THE GROWTH IS INCREASING AFTER 3RD-4TH SPRAYING
Ans 9:
Class : Class 8
The pesticide is partially effective because there is a drop in population after each spraying. Hence, B CANNOT BE THE CORRECT ANSWER.
Ans 13:
Class : Class 5
it is supposed to be D. the graph should be going down slowly and not increasing if the answer was B.
Ans 17:
Class : Class 7
it should be 'D' but SOF shows the graph is decreasing and increasing which is not possible. it is the wrong graph as this can't happen.
Ans 19:
Class : Class 8
B is answer because when it decreases it is their natural death, otherwise they have become resistant thats why it is decreasing then increasing and not uniform.