



The given bar graph shows the number of laptops manufactured
by a company over the given five months. Study the graph carefully and answer the
following questions.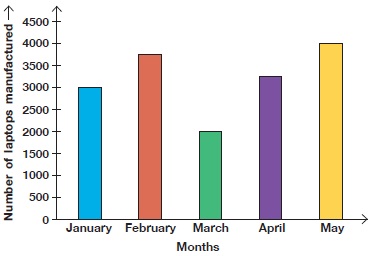
Find the fraction of number of laptops manufactured in March to the number of
laptops manufactured in April.
A7⁄15
B5⁄13
C8⁄15
D8⁄13
PROVIDE ZOOM OPTION ON THE BAR GRAPH FIGURE IS VERY SMALL TO SEE VALUES