



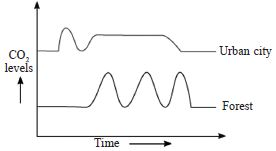
Study the graph given below that represents the variation
in carbon dioxide concentration over time in a forest
area and an urban city and select the correct option.
A Urban areas have a greater number of animals.
B Plants release carbon dioxide during photosynthesis.
C The intensity of sunlight is lower in urban areas compared to forests.
D Forests have a higher number of plants.