



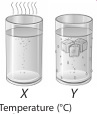
Two identical cups, X and Y are filled with water at different
temperatures as shown in the given figures. They are placed
in a room which is at a temperature of 30°C. Which one of the
following graphs correctly shows the variation in the temperature
of the water in the cups over a period of time?
A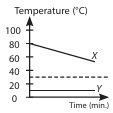
B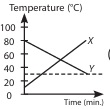
C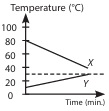
D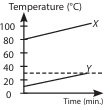
Can you give me the consept of this question