Which of the following graphs shows drying of a wet cotton shirt in the Sun?
A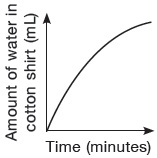
B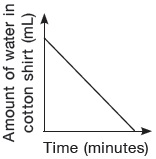
C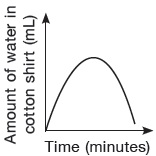
D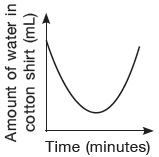
As the amount of water in the cotton shirt increases, the time in minutes should also increase. In that case the correct answer should be option a
Which of the following graphs shows drying of a wet cotton shirt in the Sun?
A
B
C
D