Which of the folloiwng graphs correctly
represents the temperature change as
a function of time as steam at 110 °C is
cooled to –10 °C?
A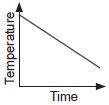
B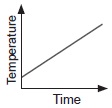
B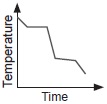
D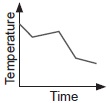
No option C
Which of the folloiwng graphs correctly
represents the temperature change as
a function of time as steam at 110 °C is
cooled to –10 °C?
A
B
B
D