The given line graph shows the number of persons
who got jobs in the given years. Study the graph carefully and answer the following questions.
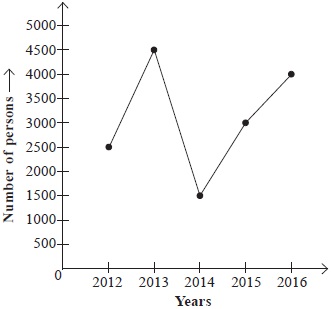
(i) How many less persons got the jobs in the year
2012 than in the years 2015 and 2016 together?
(ii) If  of the total persons who got the jobs in the year 2013 are in Government sector, then how many persons were recruited in Private sector in that year?
A(i)-4000; (ii)-2500
B(i)-3500; (ii)-2800
C(i)-3000; (ii)-2000
D(i)-4500; (ii)-2700