The graph below shows the number of visitors to the Fish Farm in various months. Study the graph carefully and answer the questions.
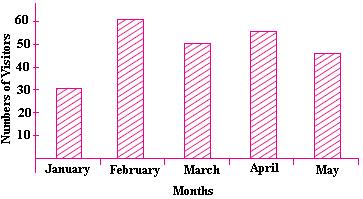
There were _____ more visitors in February than in January.
(B) 30
(C) 60
(D) 90
Answer should be B. Kindly correct it.