The graph below shows the temperature of a beaker of water as it is subjected to various treatments.
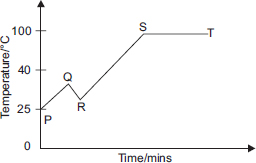
What could have taken place at point Q?
A The beaker of water was kept on burner with full flame.
B Ice cubes were added to the beaker of water.
C A small amount of salt was added to the beaker of water.
D Some water was poured out of the beaker.