The given bar graph shows the number of families with 0, 1, 2 or 3 children. Study the graph carefully and answer the given question.
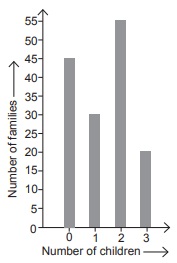
What percent of the families having 3 children to the total number of families?
A 
B 20 %
C 25 %
D 
Ayanokoji kiyotaka