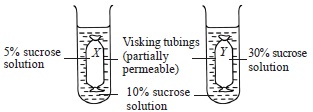
Anita set up an experiment as shown below.
Which of the following graphs correctly represents the changes in weights of Visking tubings X and Y with time?
A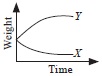
B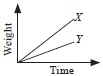
C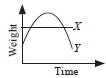
D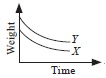
Mentioned solution is not matching with graph. It seems misprint, X and Y should be interchanged.