The given graph shows the number of people who prefer playing different sports in the given six years. Study the given graph carefully and answer the following question.
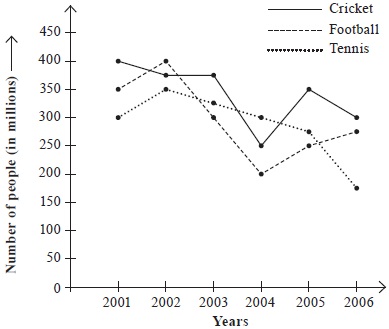
What is the ratio of the number of people who prefer playing Cricket in 2001 to the number of people who prefer playing Tennis in the year 2003?
A14 : 17
B16 : 13
C15 : 11
D13 : 15