The given bar graph shows the number of ice-creams sold by a shop in a week. Study the graph and answer the question.
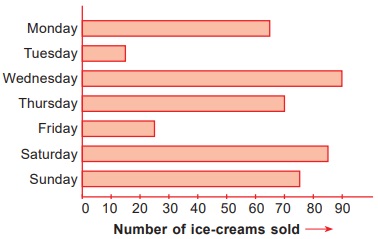
How many more ice-creams sold on Thursday than on Tuesday?
A 50
B 55
C 60
D 70
It is B.
The given bar graph shows the number of ice-creams sold by a shop in a week. Study the graph and answer the question.
How many more ice-creams sold on Thursday than on Tuesday?
A 50
B 55
C 60
D 70