The line graph shows the number of desktop and notebook computers sold at Vansh's electronic store from September to December. Study the graph carefully and answer the following question.
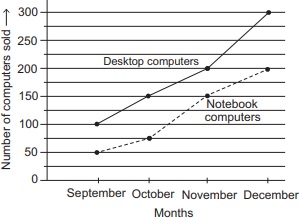
(i) How many more desktop than notebook computers did the store sell in all four months?
(ii) What fraction of notebook computers sold in November of total sale of computers in that month?
| (i) | (ii) | |
|---|---|---|
| A | 250 | 2⁄5 |
| B | 320 | 4⁄9 |
| C | 275 | 3⁄7 |
| D | 345 | 5⁄8 |