The given line graph shows the quantity of rice and wheat (in hundred tones) purchased by a firm during the year 2010-2015.
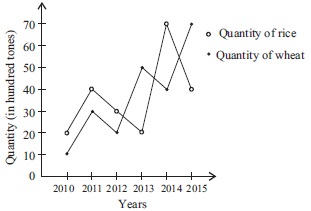
How much less quantity of wheat is purchased during 2011-2013 than the quantity of rice purchased during 2012-2014?
A30 hundred tones
B20 hundred tones
C80 hundred tones
D40 hundred tones