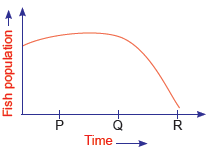
A river supports a large number of fish in its water. A new chemical factory was established near this river and the fish population was seen to decrease with time.
Which point (P, Q or R) on the graph represents the time when factory was established?
AP
BQ
CR
DEither Q or R