A cylinder is placed on a balance as shown in the figure. Water is poured into the cylinder and the reading
of the balance is recorded for different heights of water in the
cylinder.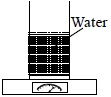
Which graph correctly shows the variation of the balance reading (say m) with the height (say h)?
A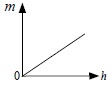
B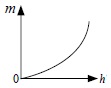
C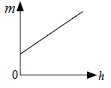
D