Anita conducted an experiment to calculate the percolation rate of water in different types of soil samples. She took 200 ml water and poured it into three different types of soil samples. She noted the time that was taken by water to percolate through soil. Which of the following graphs correctly shows the relationship between amount of water percolated through different soil samples with respect to time?
A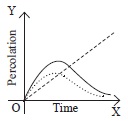
B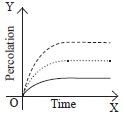
C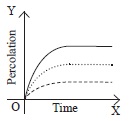
D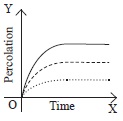
nice question