The given diagram
represents a village.
The waste material
from residential
area and factories
is dumped into the
river stream that
passes through the
village.
Which line in the graph
correctly shows the
change in the population
of aquatic fish when they
swim downstream from
points P to Q?
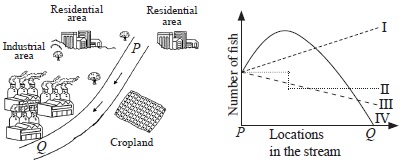
A I
B II
C III
D IV
Will the population not increase where the cropland is?