Jayesh bought three different kinds of fish, P, Q and R. He put fish P population and fish Q population into tank X, and fish P population and fish R population into Y. He recorded the number of each fish in each tank for a week. There were no dead fish in the tank when he checked every day. The graphs below show the results at the end of the week.
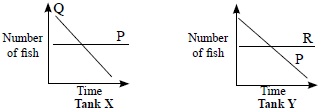
Which of the following shows the prey-predator relationship between the three fishes?
AP → Q → R
BQ → P → R
CR → P → Q
DQ → R → P
They should give pictures correctly. Right?