Mayank set-up an experiment as shown below.
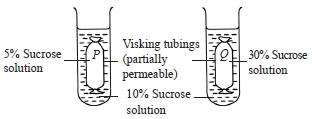
Which of the following graphs correctly represents
the changes in weights of Visking tubings P and Q?
A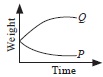
B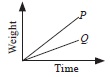
C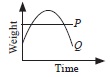
D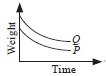
Mayank set-up an experiment as shown below.
Which of the following graphs correctly represents
the changes in weights of Visking tubings P and Q?
A
B
C
D