Direction-
The given bar graph shows the number of visitors to the Science Centre for the first 6 months of a year. Study it carefully and answer the questions that follow.
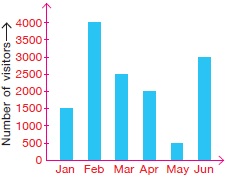
How many more people visited the Science Centre in February than in March?
How many more people visited the Science Centre in February than in March?