The graph shows the production of cycles (in thousands) of two factories A and B for ten years.
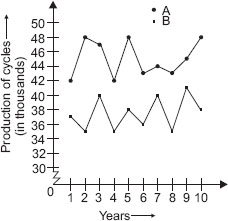
Find the production of cycles of A in the year when combined production of cycles was maximum.
A 47 thousands
B 48 thousands
C 49 thousands
D 46 thousands
Please explain, how ?