The following graphs show the level of water pollution in a particular area. Which graph depicts that chemical factories have increased in this area over time?
A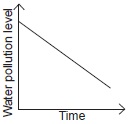
B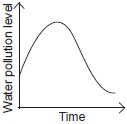
C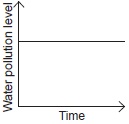
D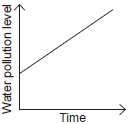
The following graphs show the level of water pollution in a particular area. Which graph depicts that chemical factories have increased in this area over time?
A
B
C
D