SIGN UP FOR FREE !
Home
/ Forum
User Forum
Ask Your Question
Kinisha Sarva
from
Little Flower public school, Churu
Subject :
NSO
Class :
Class 4
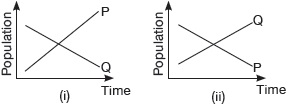
The given graphs show changes in population of two organisms P and Q, (i) when put alone and (ii) when put together. Select the correct option regarding P and Q.
View All Answers (0)
Submit Your Answers
Post Your Answer