The line graph shows the number of people who visited a museum from March to July. How many more visitors were there in April than in June?
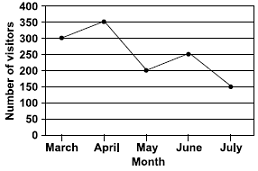
A200
B350
C150
D100
bad
The line graph shows the number of people who visited a museum from March to July. How many more visitors were there in April than in June?
A200
B350
C150
D100