Subject :NSO Class : Class 4
The given graph shows the amount of changes in the number of fish in a water body in a year.
Select the incorrect option regarding this.
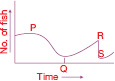
AAt time P, some factory was established near the water body that discharged its used water in it.
BAt time Q, the factory was relocated to some other part, away from the water body.
CAt time R, large amount of oil was accidentally spilled into the water body.
DAt time S, a new factory was established near the water body.
Ans 1:
Class : Class 5