Nidhi plotted a graph to show the amount of sound produced during the following activities P, Q and R. Which of the following graphs would she have obtained?

A 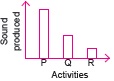
B 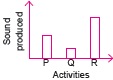
C 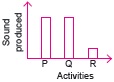
D 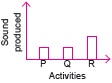
A is the correct answer
Nidhi plotted a graph to show the amount of sound produced during the following activities P, Q and R. Which of the following graphs would she have obtained?
A
B
C
D