The line graph shows the performance of two students during a year. Read the graph and answer the following questions.
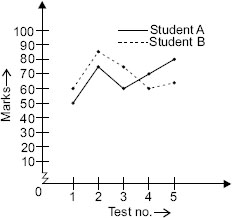
In which test student B showed his worst performance?
A Test 5
B Test 3
C Test 2
D Test 1
The line graph shows the performance of two students during a year. Read the graph and answer the following questions.
In which test student B showed his worst performance?
A Test 5
B Test 3
C Test 2
D Test 1