Run-off pollution of a particular river resulted from overuse of chemical fertilizers by a nearby farm. Which of the following graphs correctly shows the resulting changes in levels of oxygen and bacteria in this river?
A 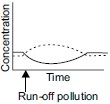
B 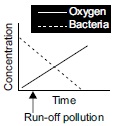
C 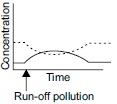
D 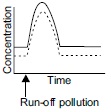
can someone please explain this