The given bar graph shows the marks obtained by a student in different subjects. The maximum marks of each subject is 100.
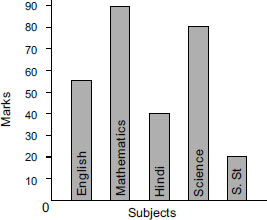
What is the ratio of the highest marks to the lowest marks obtained by the student?
A 2 : 11
B 9 : 2
C 2 : 9
D 11 : 2
The given bar graph shows the marks obtained by a student in different subjects. The maximum marks of each subject is 100.
What is the ratio of the highest marks to the lowest marks obtained by the student?
A 2 : 11
B 9 : 2
C 2 : 9
D 11 : 2