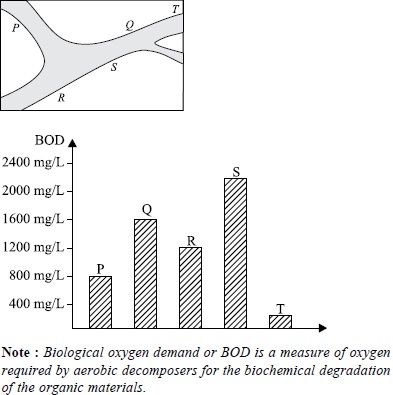
The given diagram represents the plot of a river
stream across a town. Water samples are collected
from the river from 5 different places P, Q, R, S
and T. The BOD of the collected water samples is
shown in the following bar diagram.
a. On which of the places (P to T) the highest
amount of organic material is released into the
river water?
b. Where does a water treatment plant most likely
built?
A a - R, b - Between P and Q
B a - S, b - Between Q and T
C a - Q, b - Between R and S
D a - S, b - Between P and R