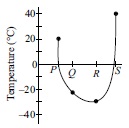
The given graph shows comparative
account of temperature range in
four habitats (P, Q, R and S).
Which of the following can be
inferred from the given graph?
(i) Animals inhabiting P may
show starling colouration
and arboreal adaptations.
(ii) Animals inhabiting Q have thick lips and leathery
skin.
(iii) Plants present in S may have thick fleshy
photosynthetic stems and leaves modified into
spines.
(iv) Animals inhabiting S possess thick layer of
subcutaneous fat and have very small body
appendages as compared to animals inhabiting
Q and R.
(v) Plants like Spruce, Acacia and Opuntia are
commonly found in habitat P.
(vi) Animals found in R may show hibernation or
seasonal migration.
A(i), (iii) and (vi) only
B(ii), (iv) and (v) only
C(i), (iv) and (v) only
D(ii), (iii) and (vi) only